
© 2026 Made for Planet • Privacy Policy • Terms & Conditions
Platform by Mission Sustainability
By Rittika rana • Jan 22, 2026

Air pollution has become a daily concern for millions of people worldwide. From deciding whether to step outside for a walk to planning long-term health precautions, knowing the pollution level of your city is no longer optional. Fortunately, several reliable platforms now track, analyse, and publish air quality and pollution data in near real time.
However, not all pollution data sources are equal. Some rely on government monitoring stations, others on satellite data or citizen sensors, and some combine multiple sources to provide a more complete picture. Below are 10 trusted websites that help you understand pollution levels in your city, region, or country, along with how to use them effectively.

IQAir is one of the most widely used platforms for tracking real-time air quality across cities worldwide. It provides city-level Air Quality Index (AQI) data, historical trends, and health recommendations.
IQAir combines data from government stations, research-grade monitors, and verified community sensors, making it a go-to source for daily pollution checks.https://www.iqair.com

The World Air Quality Index (WAQI) project aggregates air quality data from thousands of monitoring stations across the globe. It is particularly useful for comparing pollution levels between cities and understanding regional trends.
WAQI is widely referenced by researchers, policymakers, and the public for transparent, station-level pollution data. https://aqicn.org
OpenAQ is an open-source platform that provides access to air quality data collected from government and research institutions worldwide. Unlike consumer-facing dashboards, OpenAQ focuses on data transparency and long-term analysis.
It is especially useful for researchers, journalists, and organisations analysing pollution trends over time. https://openaq.org
For Indian cities, the Central Pollution Control Board (CPCB) is the official authority responsible for monitoring air quality. It publishes real-time and historical pollution data through national monitoring networks.
CPCB data is considered authoritative and is widely used for policy decisions and public advisories in India. https://cpcb.nic.in

The European Environment Agency (EEA) provides detailed air quality data for cities across Europe. Its platform integrates national monitoring networks and offers both real-time updates and long-term exposure insights.
EEA data is particularly useful for understanding regulatory thresholds and compliance across European countries. https://www.eea.europa.eu
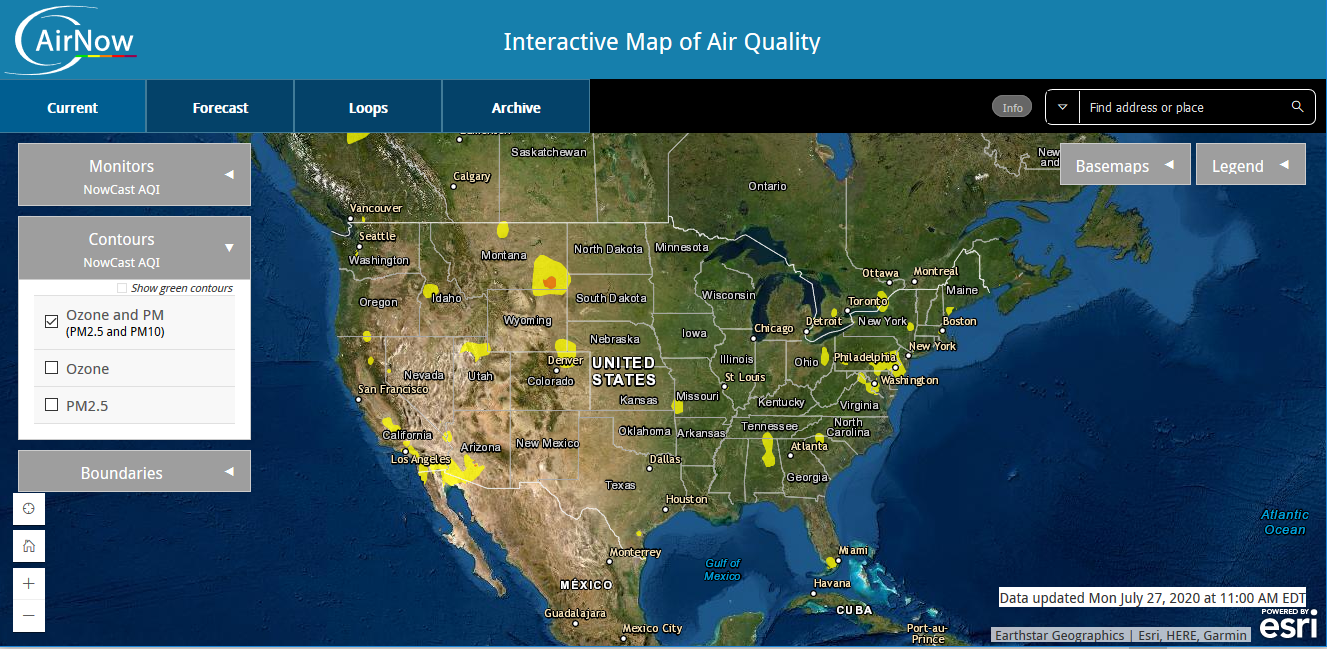
AirNow is the official air quality information platform of the United States government. It provides city and regional air quality data, forecasts, and health guidance.
The platform is especially helpful for understanding pollution exposure risks and recommended actions during high-pollution events. https://www.airnow.gov

BreezoMeter provides hyper-local air quality data using a combination of satellite data, modelling, and ground sensors. It is widely integrated into weather apps, navigation tools, and smart devices.
The platform is useful for users looking for street-level pollution insights rather than city-wide averages. https://www.breezometer.com

NASA Earth Observatory offers satellite-based insights into air pollution, aerosols, and atmospheric changes. While not designed for daily AQI checks, it provides valuable context on large-scale pollution patterns.
It is particularly useful for understanding wildfire smoke, dust storms, and transboundary pollution. https://earthobservatory.nasa.gov
.jpg)
UK Air Information is the official air quality service of the United Kingdom. It provides real-time pollution data, forecasts, and health advice based on national monitoring stations.
The platform is well-suited for residents seeking reliable, government-backed pollution data. https://uk-air.defra.gov.uk
The Air Quality Open Data Platform, supported by global environmental initiatives, aggregates pollution data from multiple countries to improve accessibility and transparency.
It is particularly useful for comparing pollution data across cities in developing and emerging economies. https://aqop.epa.gov
The best website depends on your needs:
Daily health decisions: Consumer platforms like IQAir or AirNow
City comparisons: WAQI or EEA dashboards
Research and analysis: OpenAQ or NASA Earth Observatory
Official data: National pollution control authorities
Using more than one source often provides the most accurate understanding of pollution conditions.
Knowing the pollution level of your city empowers better health choices, informed advocacy, and long-term awareness. While no single platform captures every detail, the websites listed above provide reliable, widely trusted pollution data for cities around the world.
As air pollution continues to affect urban life, access to transparent and accurate information will remain essential. Checking pollution levels regularly is no longer just for researchers or policymakers. It is a practical step toward protecting personal and public health.
You can check the pollution level of your city using air quality monitoring websites that provide real-time AQI data, historical trends, and health advisories based on official monitoring stations and sensors.
Pollution level is usually expressed through the Air Quality Index (AQI), which converts concentrations of pollutants like PM2.5 and NO₂ into a simple scale indicating how safe or harmful the air is.
Accuracy depends on data sources. Platforms that combine government monitoring stations with validated sensors generally provide the most reliable picture of pollution in a city.
Differences arise due to sensor locations, data update frequency, averaging methods, and whether satellite or ground-level data is used.
Most pollution monitoring websites update data hourly or in near real time, while some government platforms update data at fixed intervals.
Yes, many non-government platforms use official data sources or validated sensors, but it’s best to cross-check with at least one authoritative source.
No. Pollution levels can vary widely within a city depending on traffic density, industrial areas, green cover, and weather conditions.
PM2.5, PM10, nitrogen dioxide, ozone, sulfur dioxide, and carbon monoxide are the most commonly tracked pollutants affecting urban air quality.
Tracking pollution levels helps you make informed decisions about outdoor activities, health precautions, commuting, and long-term exposure risks.
Using more than one website provides a better understanding of pollution patterns, as each platform may use different data sources and methodologies.
Related Categories
Share this blog
